A Data-Driven Approach to Personal Health and Fitness
In 2023, I embarked on a personal health and fitness journey with a focus on a data-driven approach. By diligently tracking my calorie intake, body weight measurements, and workout history, my goal was to build muscle mass while maintaining a lean body fat percentage. I used two free fitness tracking apps, Strong and Renpho Health, to gather and analyze my data.
Tracking and Analysis
Over the year, I systematically recorded my daily calorie intake, weight, and workout routines. This methodical approach provided me with valuable insights and helped me make informed decisions about my fitness regimen.
I extracted three distinct data tables in XLS format from my fitness apps, covering workout history, weight, and calorie measurements. The raw data required additional cleaning to ensure accuracy and consistency before visualization. After cleaning the data, I uploaded all three tables to Tableau to create visual graphs.
Below, you will find links to the three XLS files and the Tableau dashboard. Let’s explore the four graphs for some interesting findings.
Workout History - Link
Weight Measurements - Link
Calorie Intake - Link
Detailed Fitness Insight - Tableau Dashboard Link
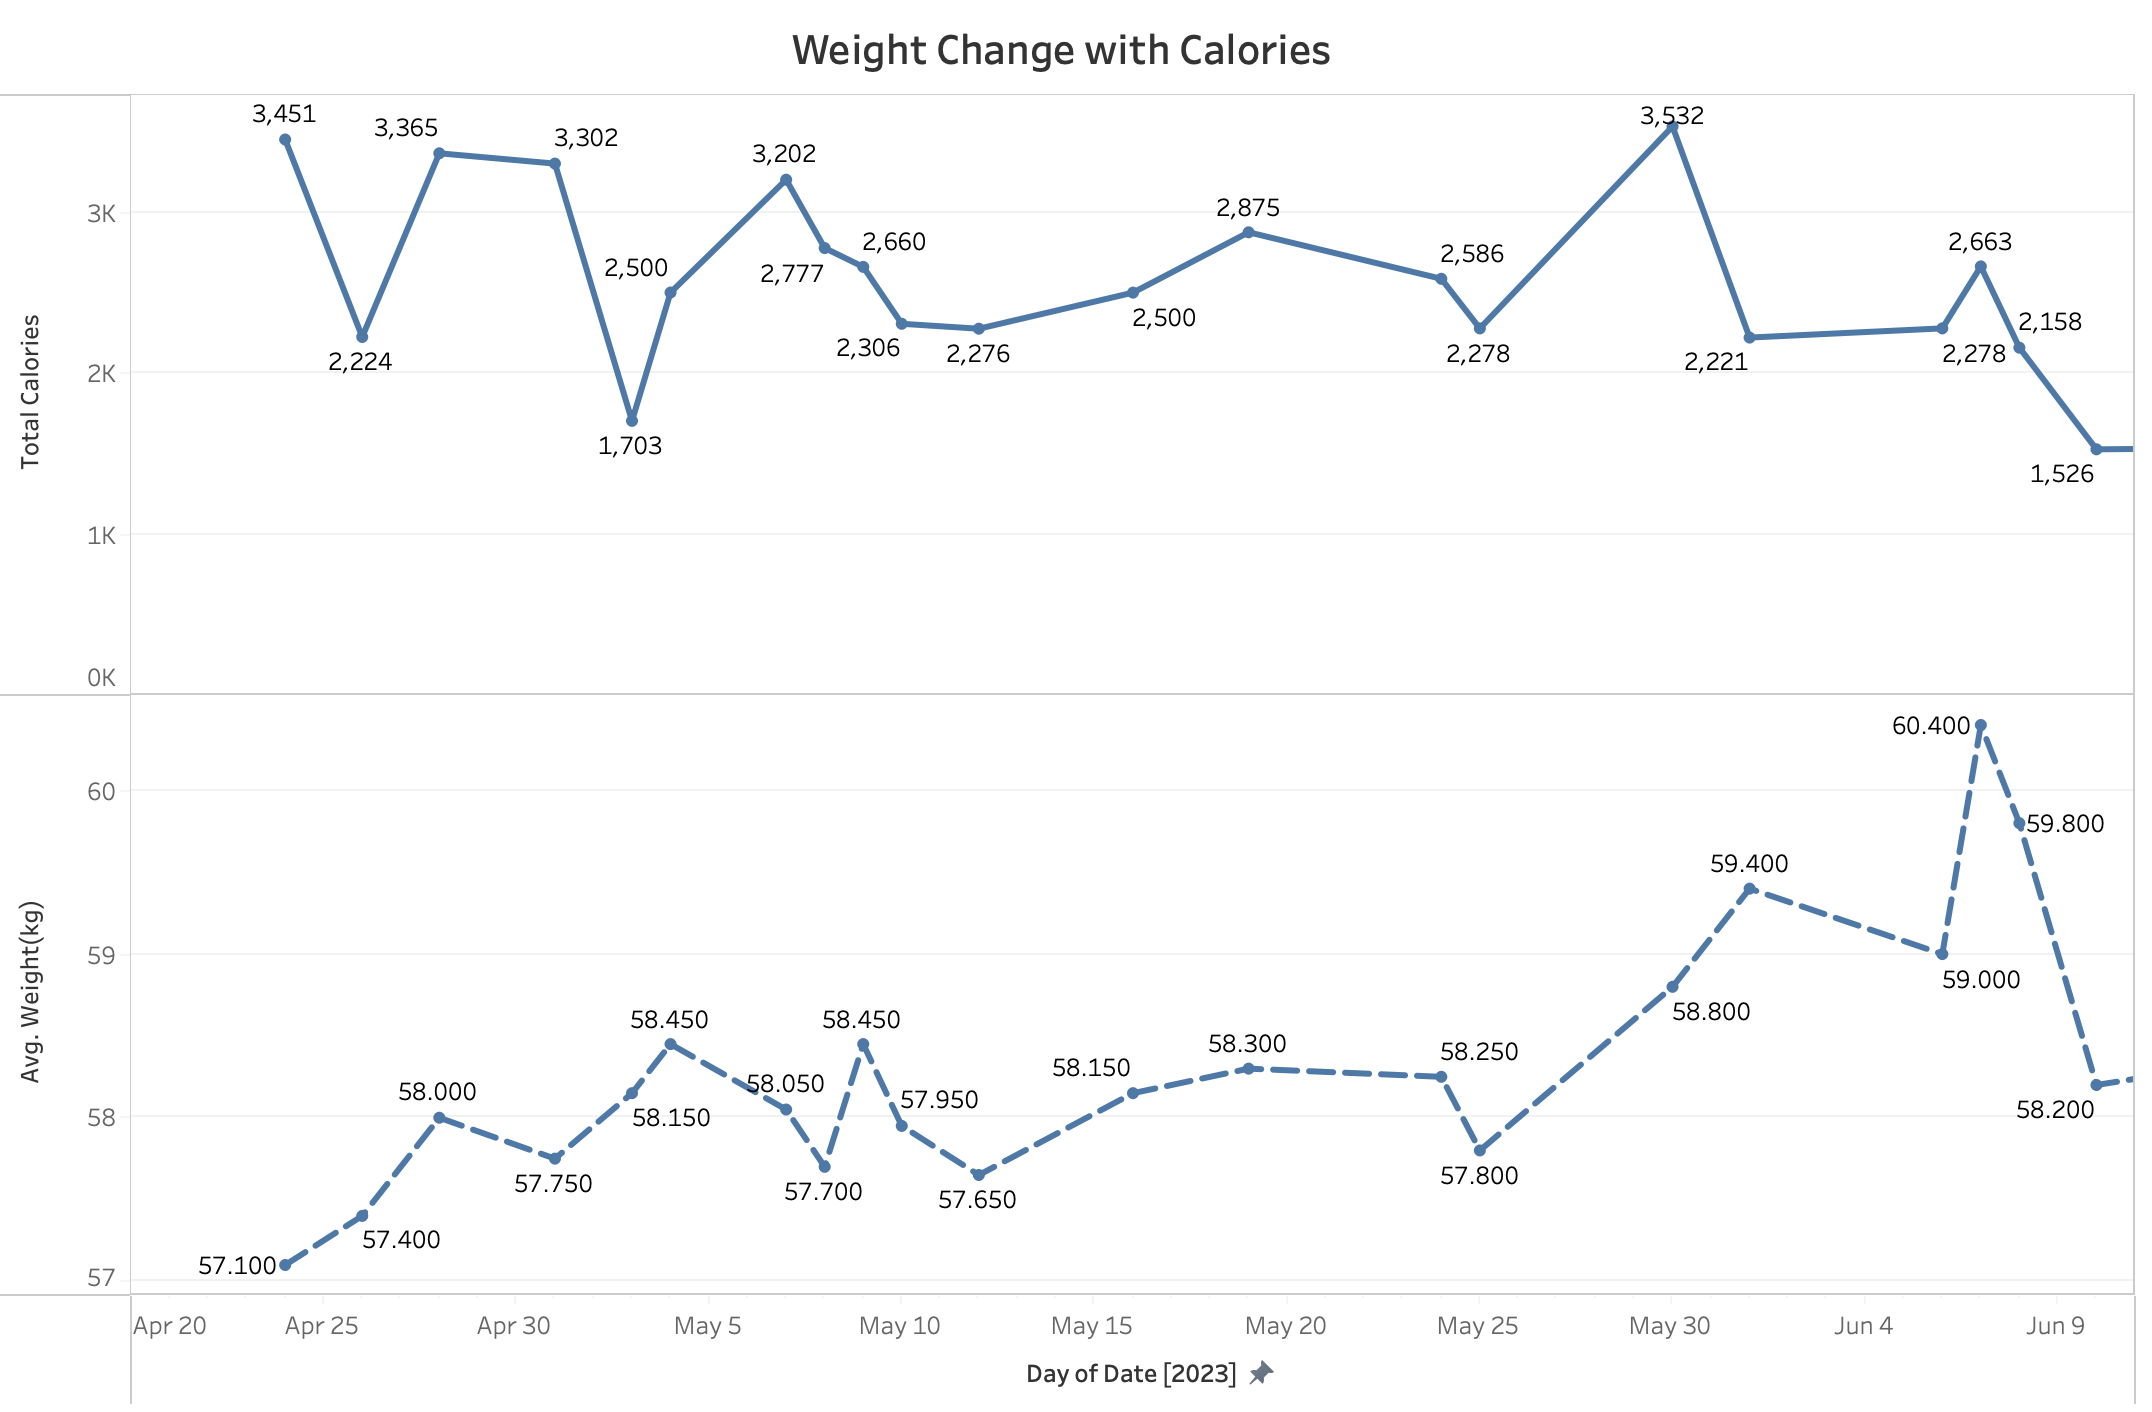
Weight Change with Calories
Caloric Intake Analysis:
Consistency: The average daily caloric intake fluctuates but remained within a general range of 2,000 to 3,500 calories.
Weight Trend Analysis
Baseline Stability: Weight exhibits relative stability, fluctuating around a baseline of approximately 58 kg. Short-term variations are present, but there is no drastic long-term weight change.
Weight Peaks: Notable peaks in weight occur on June 4 (60.4 kg) and June 6 (59.8 kg). These might correspond to the highest caloric intake periods, indicating a correlation between increased calorie consumption and short-term weight gain.
Significant Dips: Weight dips are observed on April 20 (57.1 kg) and May 8 (57.65 kg). These dips might align with lower caloric intake periods, suggesting effective weight control or loss during these times.
Correlation Insights
Caloric Intake and Weight Correlation:
Positive Correlation: There is a noticeable positive correlation between higher caloric intake and subsequent weight increases. For example, the high intake on June 4 (3,532 calories) is followed by a weight peak on June 6 (60.4 kg).
Lag Effect: The effect of caloric intake on weight appears to have a lag, where increased intake results in weight gain within a few days. This lag indicates the body's metabolic response time to dietary changes.
Caloric Deficit and Weight Reduction:
Deficit Periods: Periods of lower caloric intake often precede weight dips, such as the drop in calories on April 28 (1,703 calories) followed by a weight dip around the same period. This reinforces the effectiveness of caloric deficit in weight reduction.
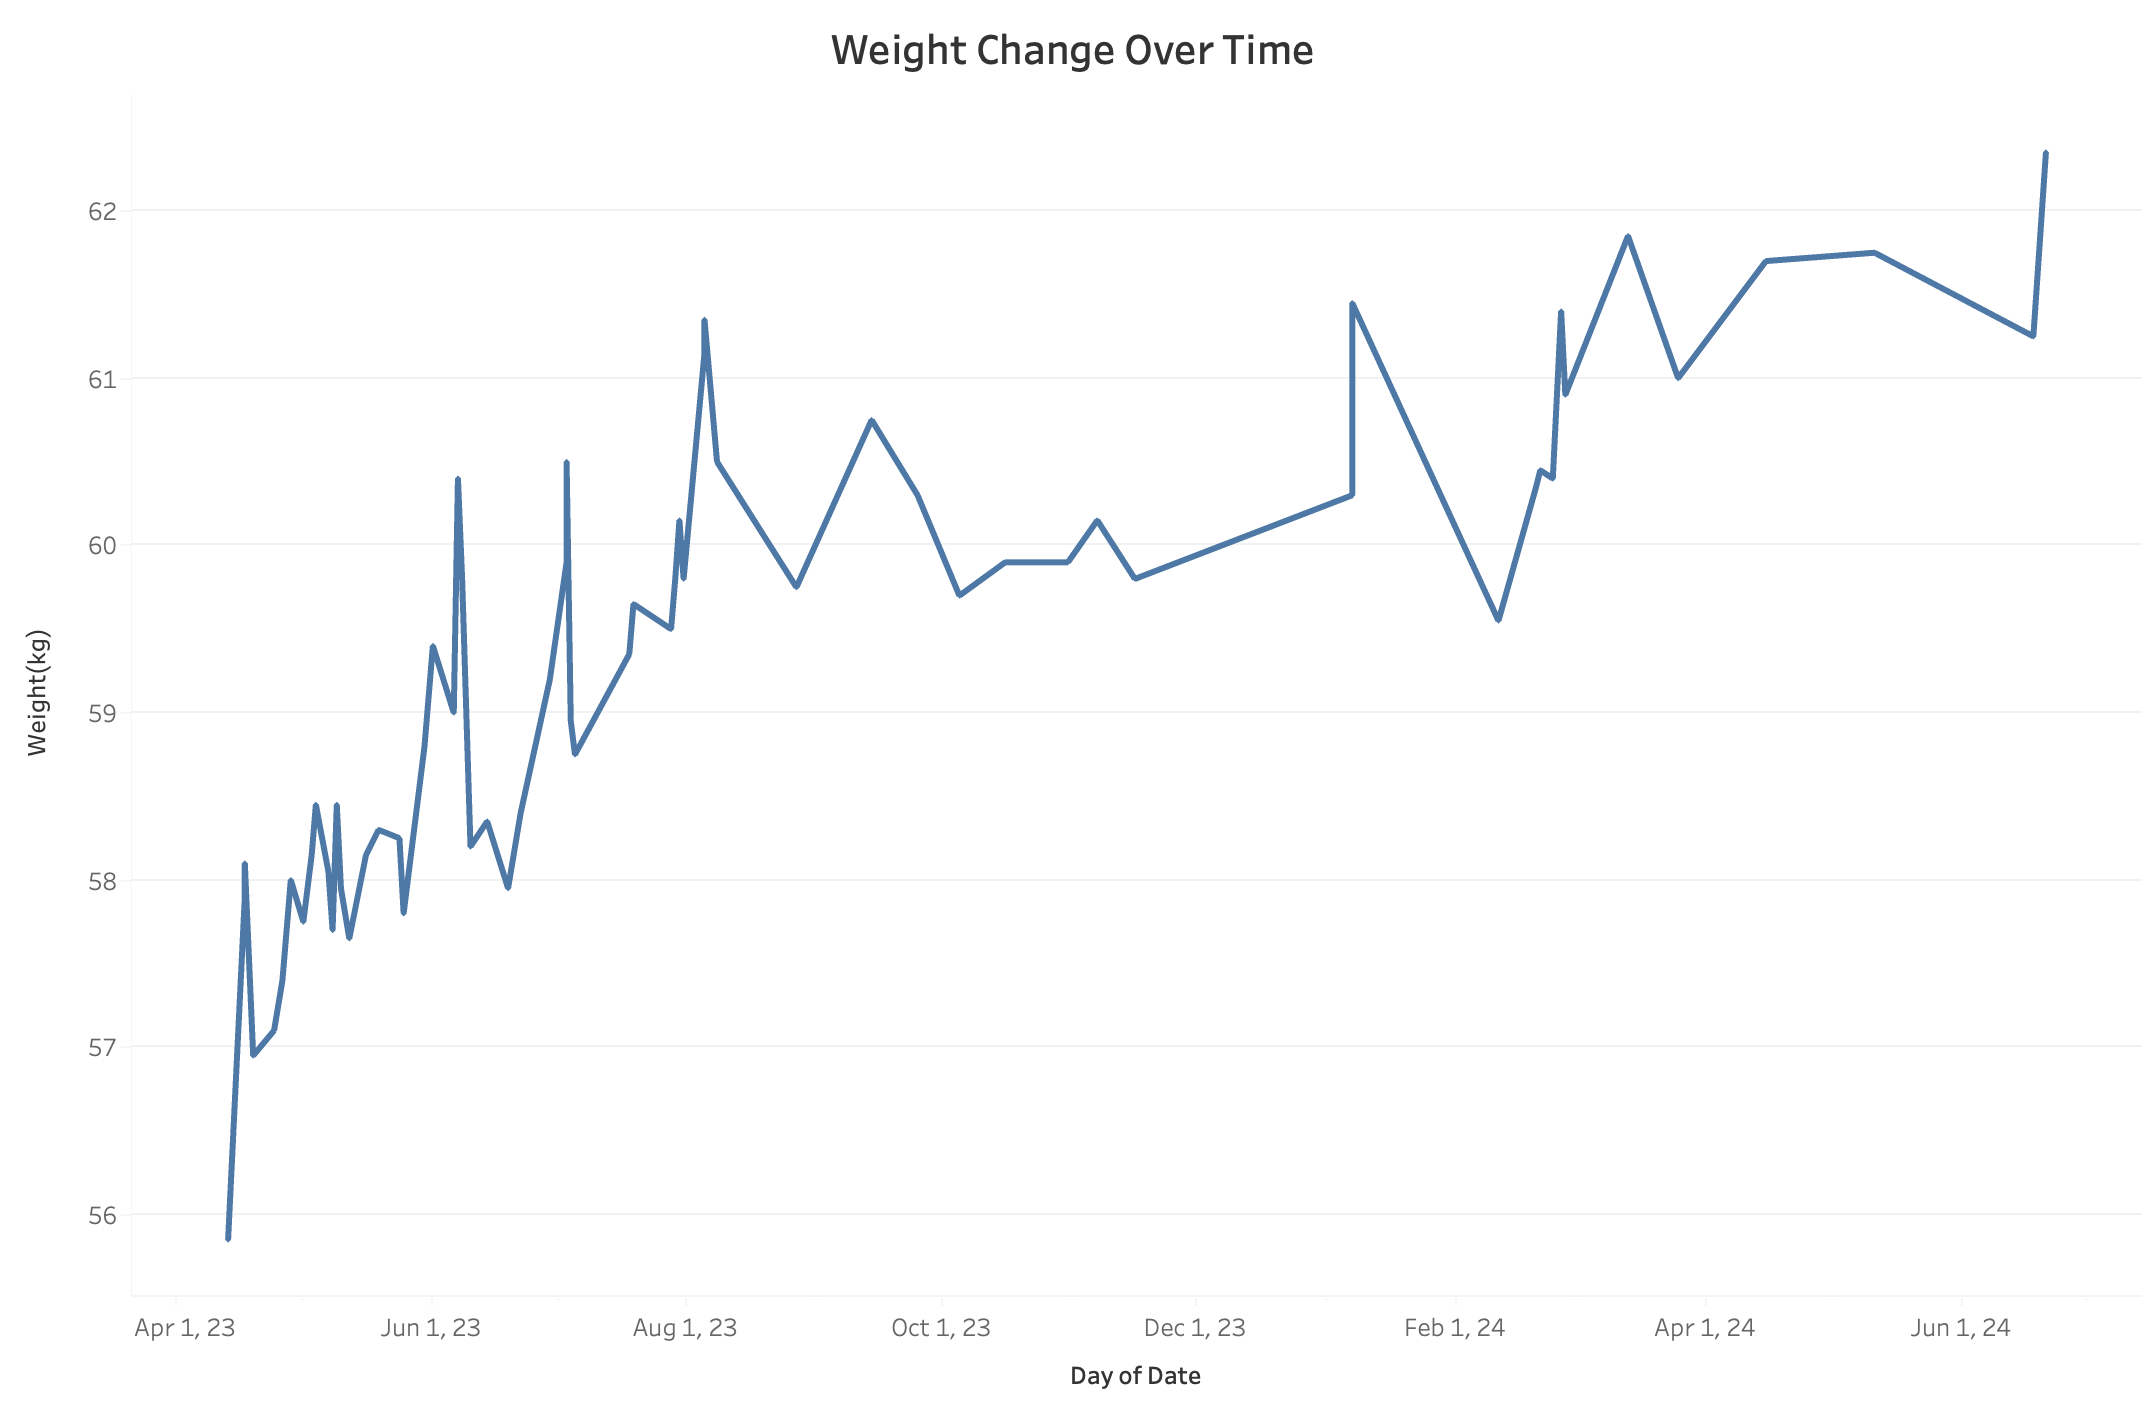
Weight Change Over Time
General Upward Trend:
Initial Weight: Starting at around 56 kg in early April 2023, your weight shows a general upward trend, peaking at around 62 kg by June 2024. This indicates a steady increase in body mass over the 15-month period.
Variability: There are frequent short-term fluctuations in weight, with several peaks and troughs. This variability could be attributed to changes in diet, hydration levels, and training intensity.
Consistent Gains:
Rate of Increase: The overall increase of approximately 6 kg over 15 months suggests an average monthly gain of 0.4 kg. This consistent gain reflects an effective strategy in muscle building or overall body mass increase
Insights
Effective Bulking Strategy: The consistent overall increase in weight suggests a successful bulking strategy. This includes periods of increased caloric intake and resistance training, leading to muscle mass gain.
Maintenance Phases: The plateaus indicate effective maintenance phases, where the focus might have shifted to preserving muscle mass and avoiding fat gain. These phases are crucial for allowing the body to adapt to new muscle mass.
Adaptation and Recovery: The fluctuations and periodic dips suggest times of adaptation and recovery, where the body might be adjusting to new muscle mass or recovering from intensive training periods. Recognizing these periods can help optimize training cycles and avoid overtraining.
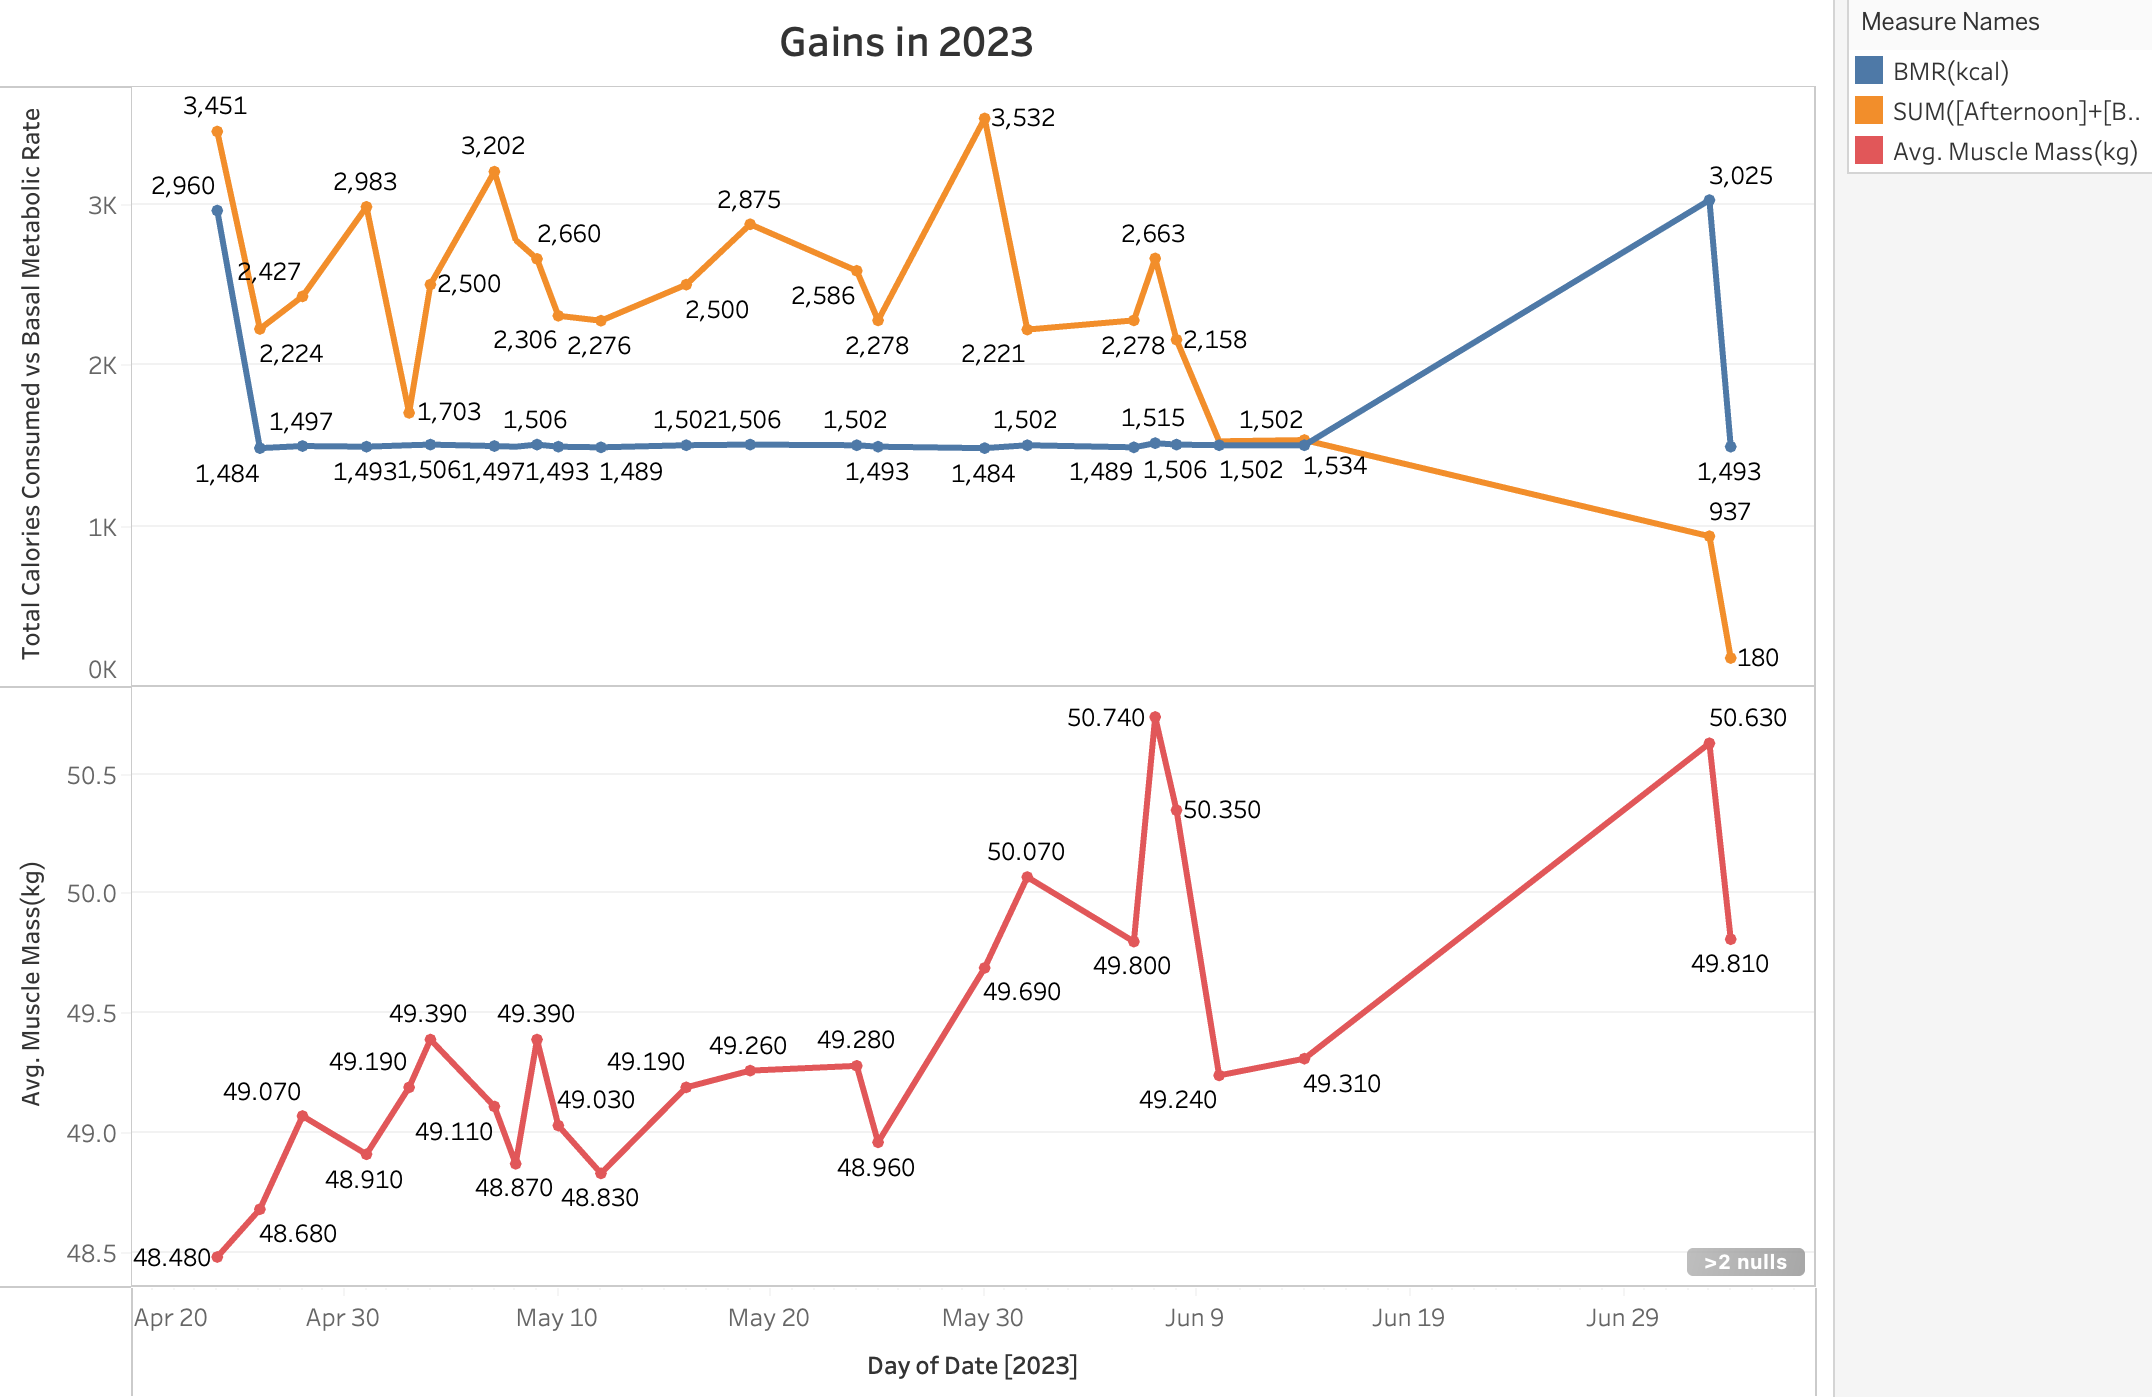
Gains in 2023
Caloric Intake vs. BMR:
Consistent BMR: The BMR line remains relatively stable around 1,500 calories. This indicates a consistent metabolic rate throughout the observed period.
Caloric Surplus/Deficit: There are several instances where caloric intake significantly exceeds the BMR (e.g., April 20, May 27), indicating a caloric surplus. Conversely, periods of caloric intake below the BMR (e.g., April 25, May 20) indicate a caloric deficit. These fluctuations suggest strategic phases of bulking and cutting.
Muscle Mass Increase:
Overall Trend: There is a general upward trend in average muscle mass, from 48.48 kg in April 2023 to 50.63 kg by late June 2023. This increase suggests successful muscle-building efforts over the period.
Significant Gains: Notable increases in muscle mass are observed around May 27 (50.07 kg) and June 4 (50.74 kg). These periods of gain coincide with high caloric intake, indicating effective bulking phases.
Correlation Insights
Positive Correlation: High caloric intake periods generally correspond with muscle mass gains. For instance, the peak in caloric intake on May 27 aligns with a significant increase in muscle mass, indicating the body's positive response to surplus calories in muscle building.
Lag Effect: The muscle mass increase often lags slightly behind the peak in caloric intake, suggesting the body's time to metabolize and convert the excess calories into muscle.
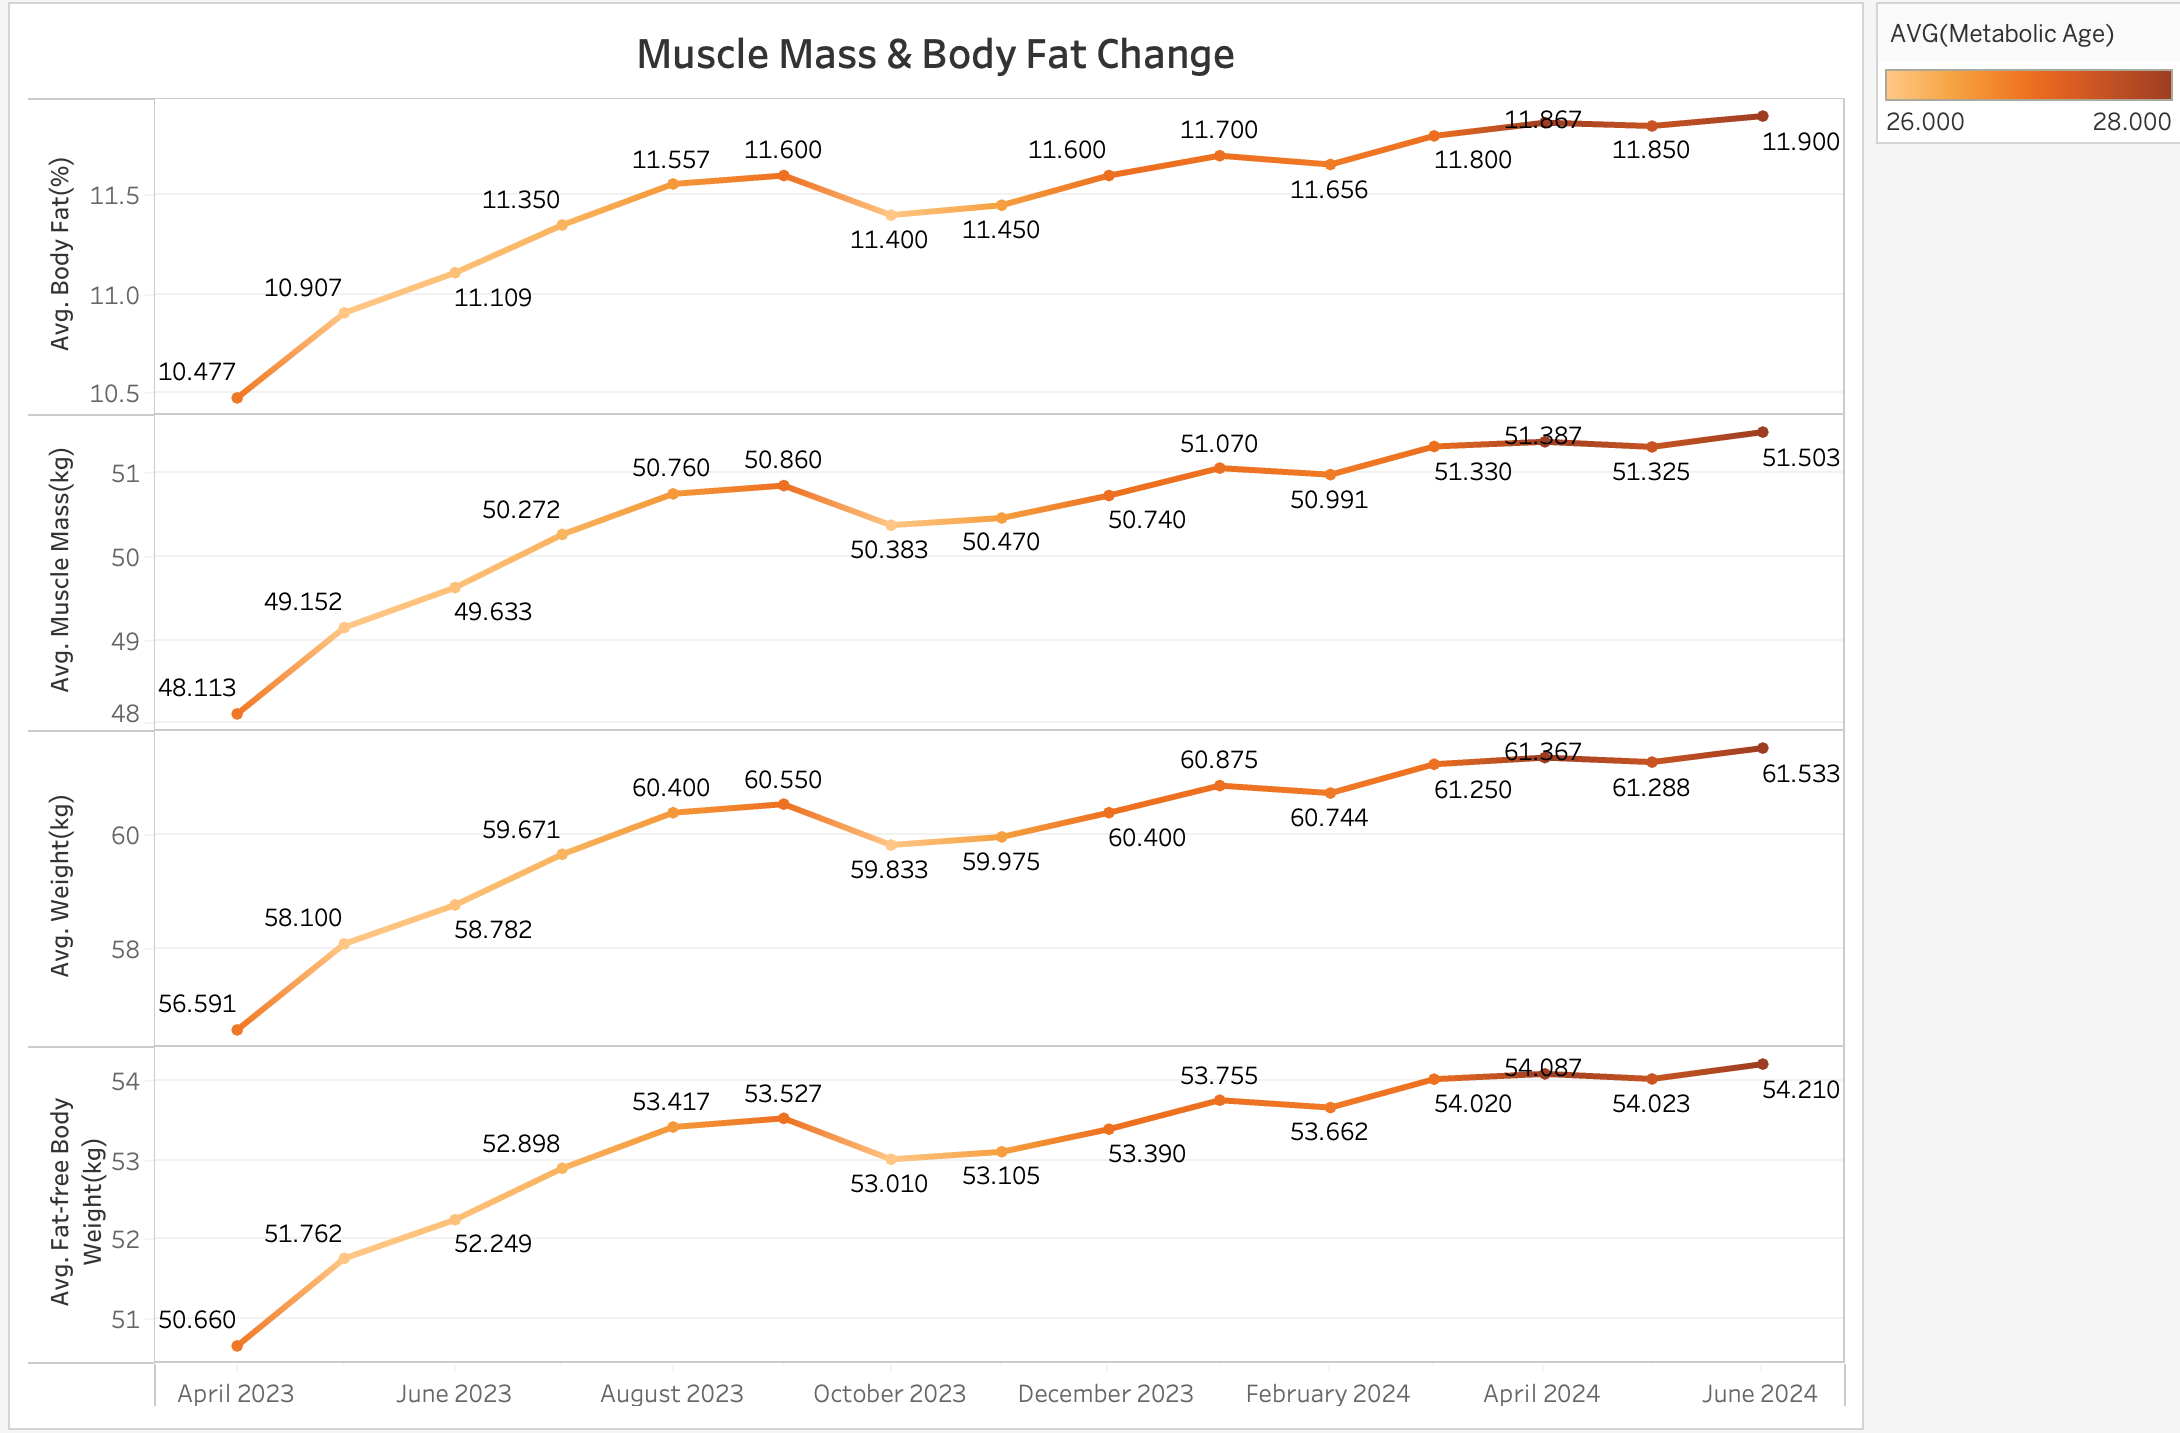
Muscle Mass & Body Fat Change
Growth Pattern:
Muscle mass shows a steady increase from 48.113 kg in April 2023 to 51.503 kg in June 2024. This represents a gain of approximately 3.39 kg, indicating effective muscle-building efforts.
Fat-free Body WeightTrend Analysis:
Fat-free body weight shows an increase from 50.660 kg in April 2023 to 54.210 kg in June 2024, indicating a gain of approximately 3.55 kg. This increase closely aligns with muscle mass gains, suggesting that most of the weight gain is attributable to muscle rather than fat.
Stable Metabolic Age:
The average metabolic age remains relatively stable, fluctuating between 26.000 and 28.000. This stability suggests that your metabolic health has been maintained throughout the period, which is a positive indicator of overall fitness.
Correlation Insights
Muscle Mass and Weight:
The positive correlation between muscle mass and overall weight gain indicates that weight increases are largely due to muscle gain rather than fat accumulation.
The close alignment between fat-free body weight and muscle mass suggests effective training and nutrition strategies aimed at muscle preservation and growth.
Body Fat and Muscle Mass:
The slight increase in body fat percentage alongside muscle mass gains suggests that while muscle mass is increasing, there may be periods where caloric intake slightly exceeds the optimal range for minimizing fat gain. Fine-tuning dietary intake could help balance muscle gain with minimal fat accumulation.
Stability in Metabolic Age:
My metabolic age remains relatively stable between 26.000 and 28.000 throughout the observed period. This suggests that overall metabolic health is being maintained despite fluctuations in body composition.
Consistency with Muscle Mass and Fat Changes:
The stable metabolic age indicates that despite increases in muscle mass and slight increases in body fat percentage, the metabolic efficiency has not been adversely affected. This is a positive sign that your metabolic rate is keeping pace with your changes in body composition.


